

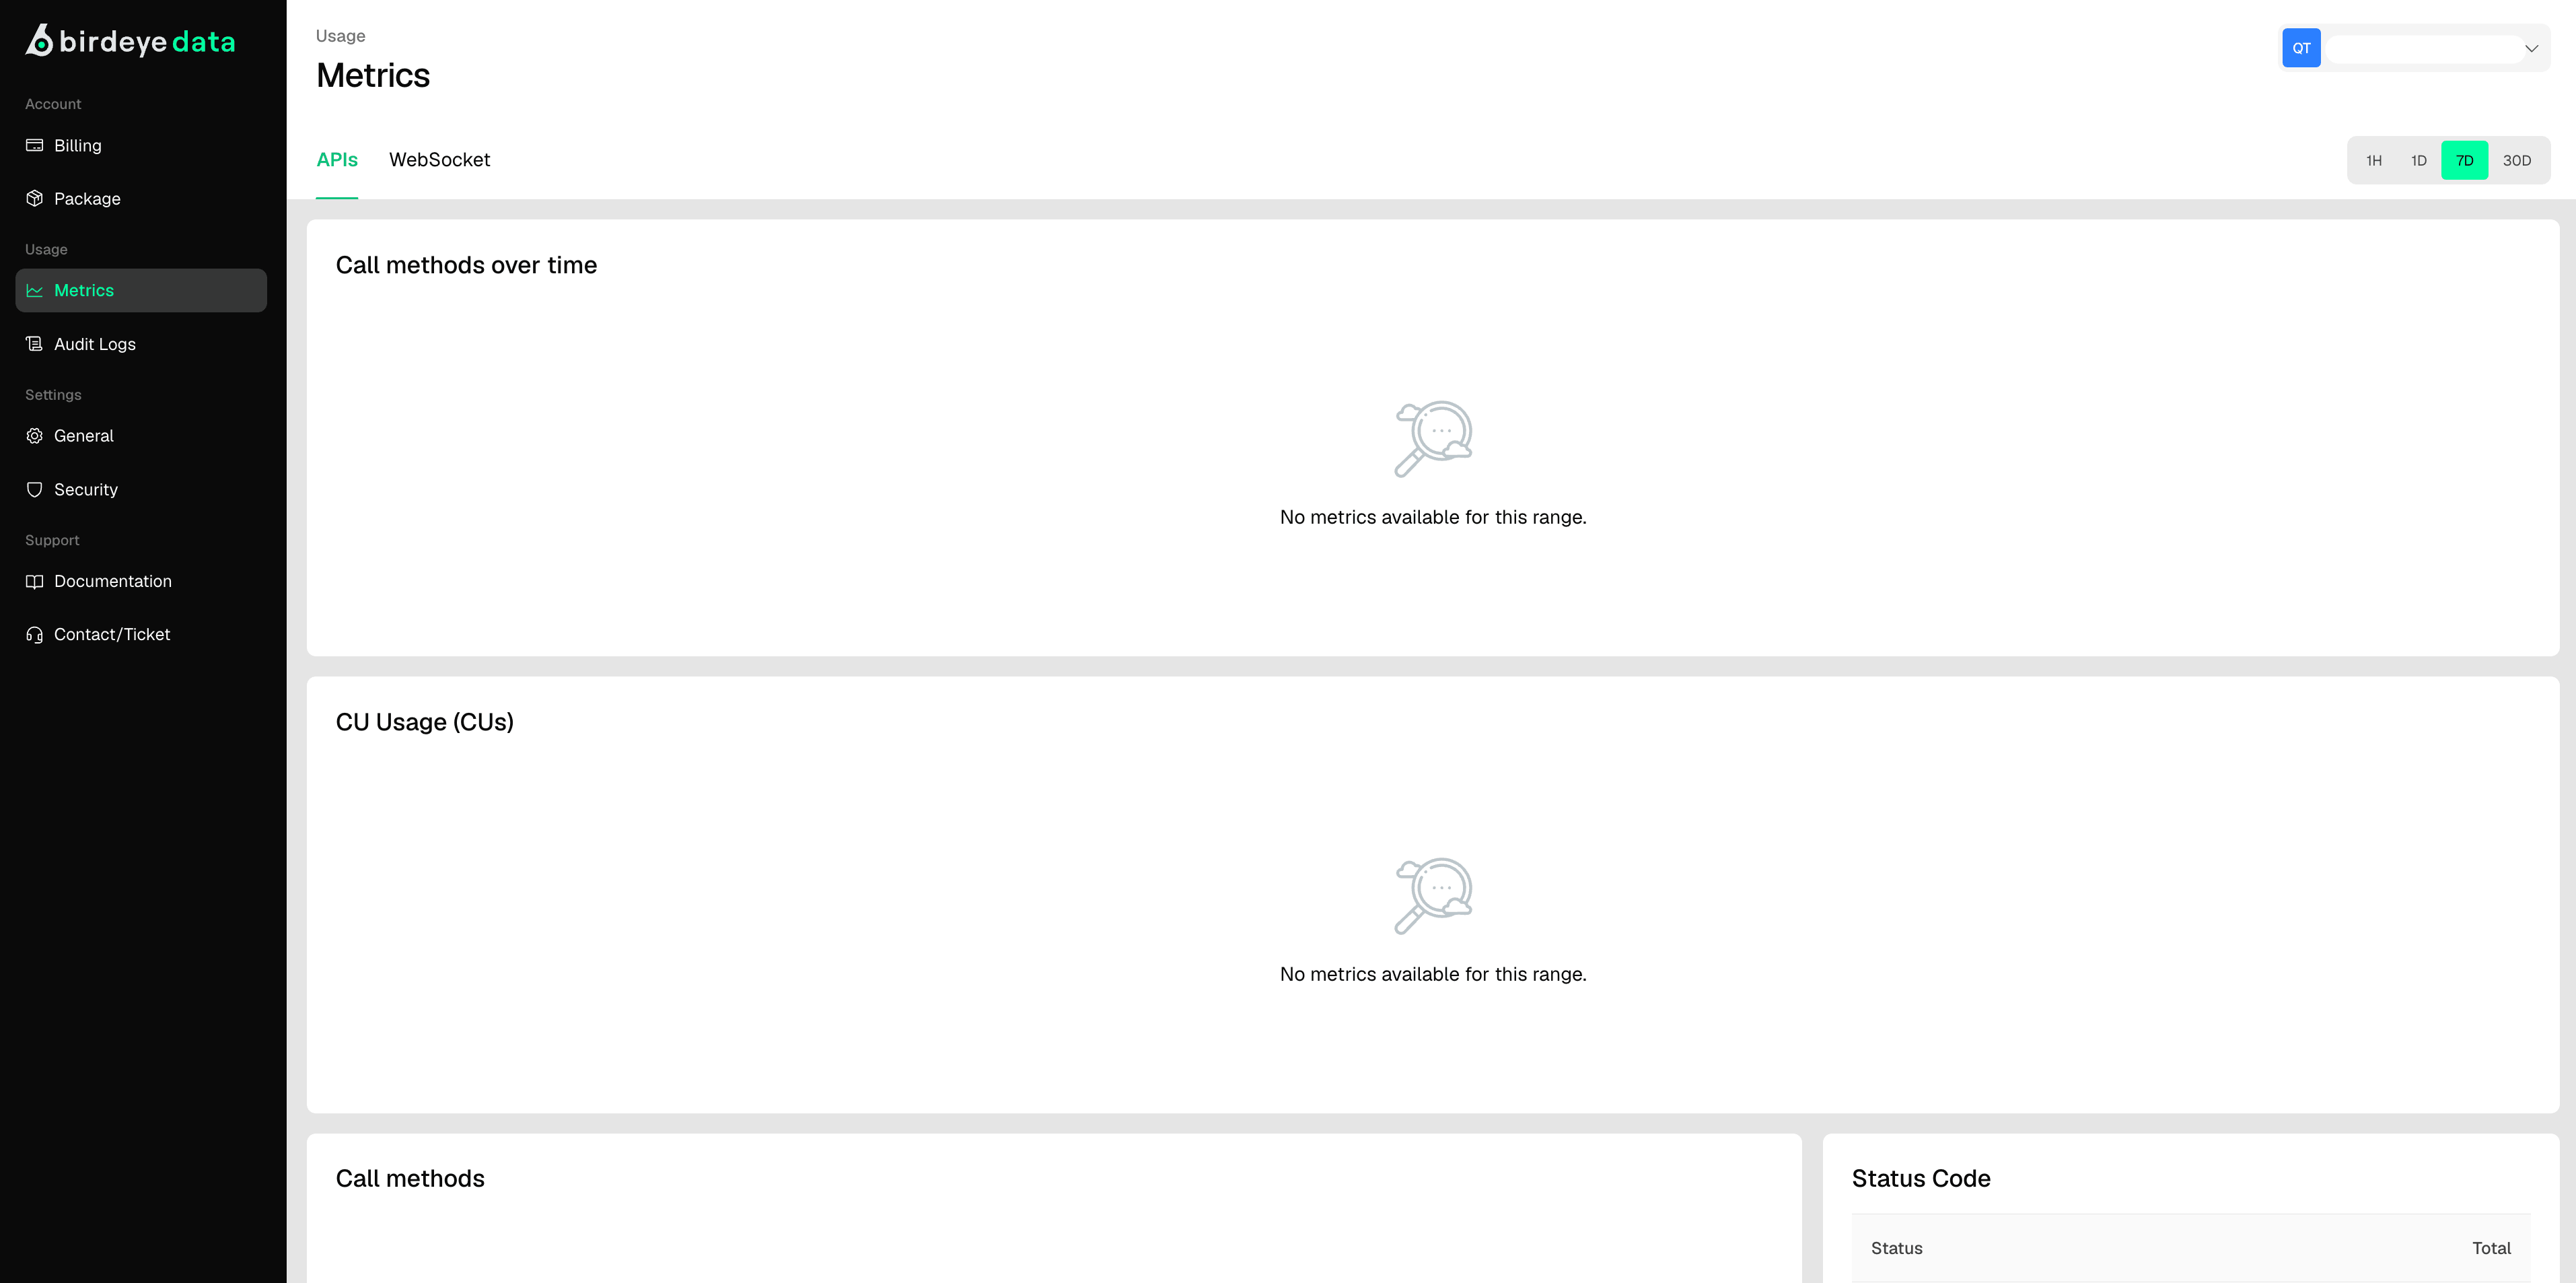
Select API Type
- Toggle between APIs and WebSocket tabs at the top to choose the data stream you wish to monitor.
- Choose Time Range
- Use the time filter to adjust your view:
- 1H – Last 1 Hour
- 1D – Last 24 Hours
- 7D – Last 7 Days
- 30D – Last 30 Days
- Use the time filter to adjust your view:
Metrics Overview (Panels Explained)
- Call Methods Over Time Visualizes the frequency of different API methods (e.g., /price, /pair) over your selected time range.
- CU Usage (Compute Units) Shows compute unit consumption trends, helping you track and optimize costs.
- Call Methods Displays a summary of the API methods being used, sorted by usage frequency.
- Status Code Distribution Breaks down HTTP status codes (e.g., 200, 400, 500) to help you identify failed or errored calls.
- Status Codes Over Time Allows you to monitor the health of your API traffic with a timeline of status code occurrences.
- Response Time Provides an average response time for your API calls, key for tracking performance and latency.
No Data Displayed?
If you’re seeing “No data”:- Confirm that your API calls have been made during the selected time range.
- Ensure your API keys are correctly configured and in use.
- Check that the correct data stream (API or WebSocket) is selected.