
What you can build
With Birdeye MCP, your agent can:- Access real-time market data: Get aggregated prices, market cap, and trading volume for over 15k+ coins on Birdeye.
- Dive into onchain analytics: Query onchain DEX price and liquidity data for more than 8M tokens across 10+ networks.
- Discover market trends: Instantly find trending coins, new token listings, top gainers/losers, and popular NFT collections.
- Retrieve rich metadata: Pull essential details like project descriptions, logos, social links, contract addresses, security info, and more.
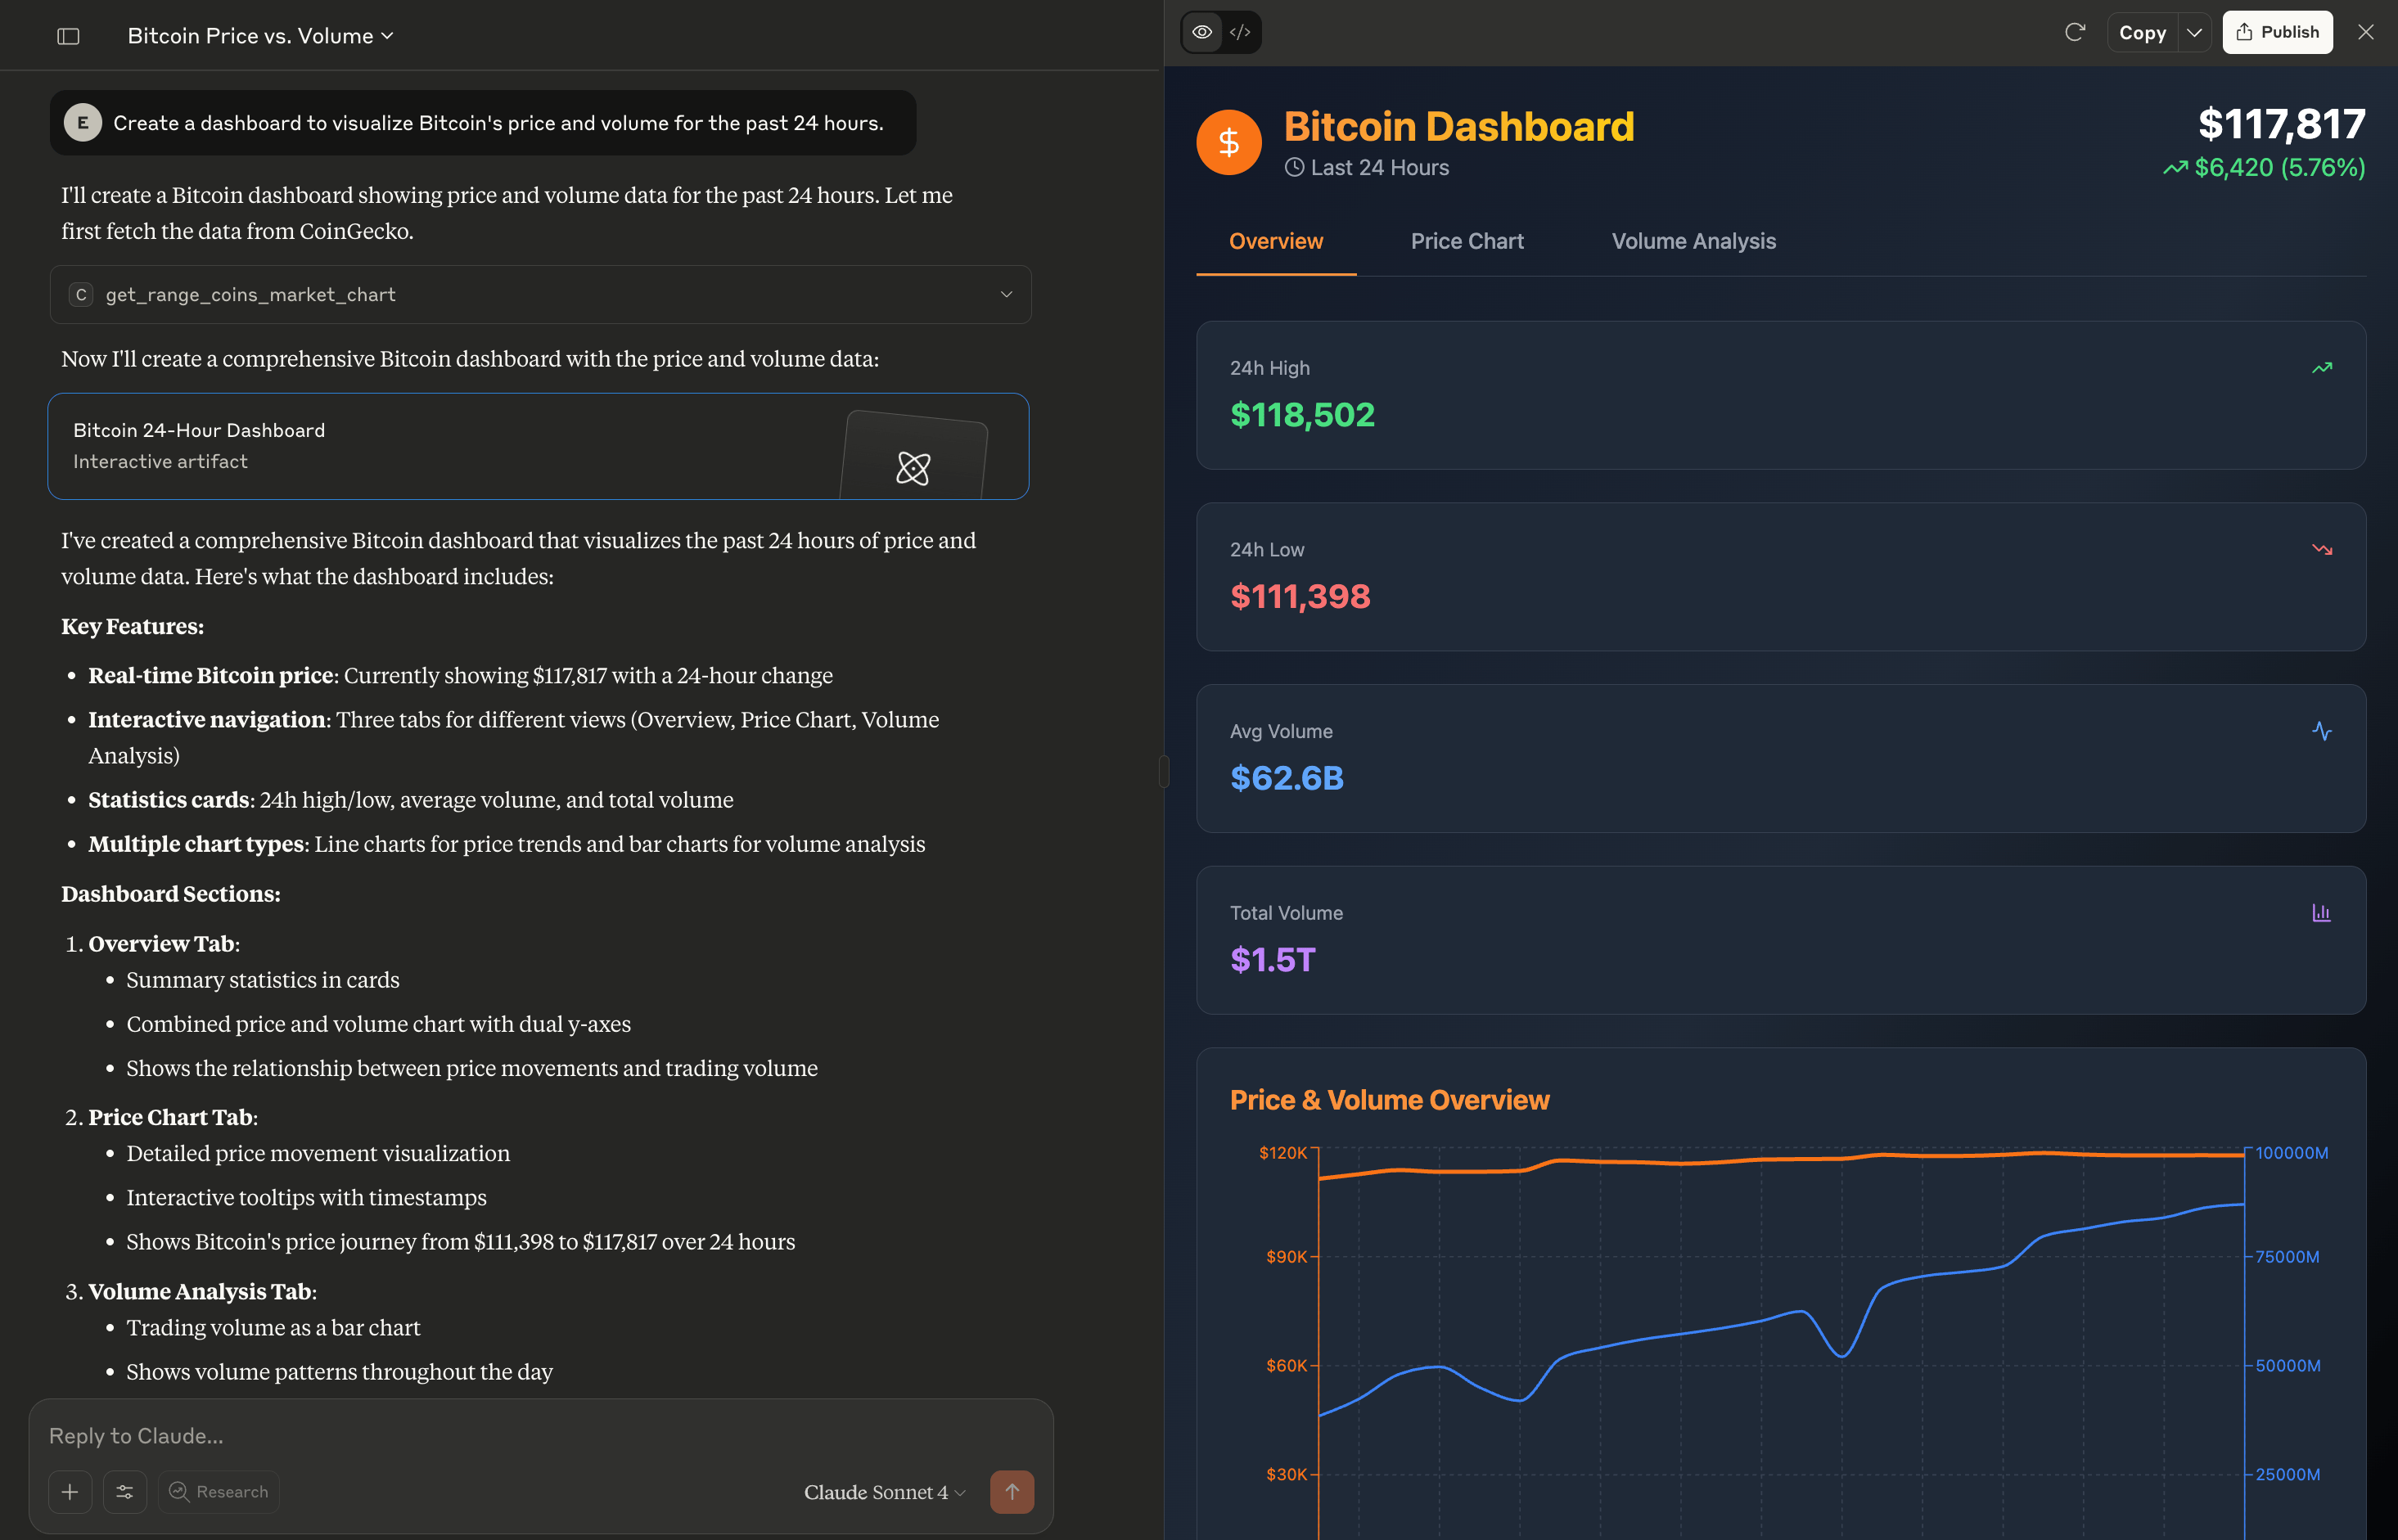
- Analyze historical performance: Access historical price, market data, and OHLCV for any cryptocurrency.
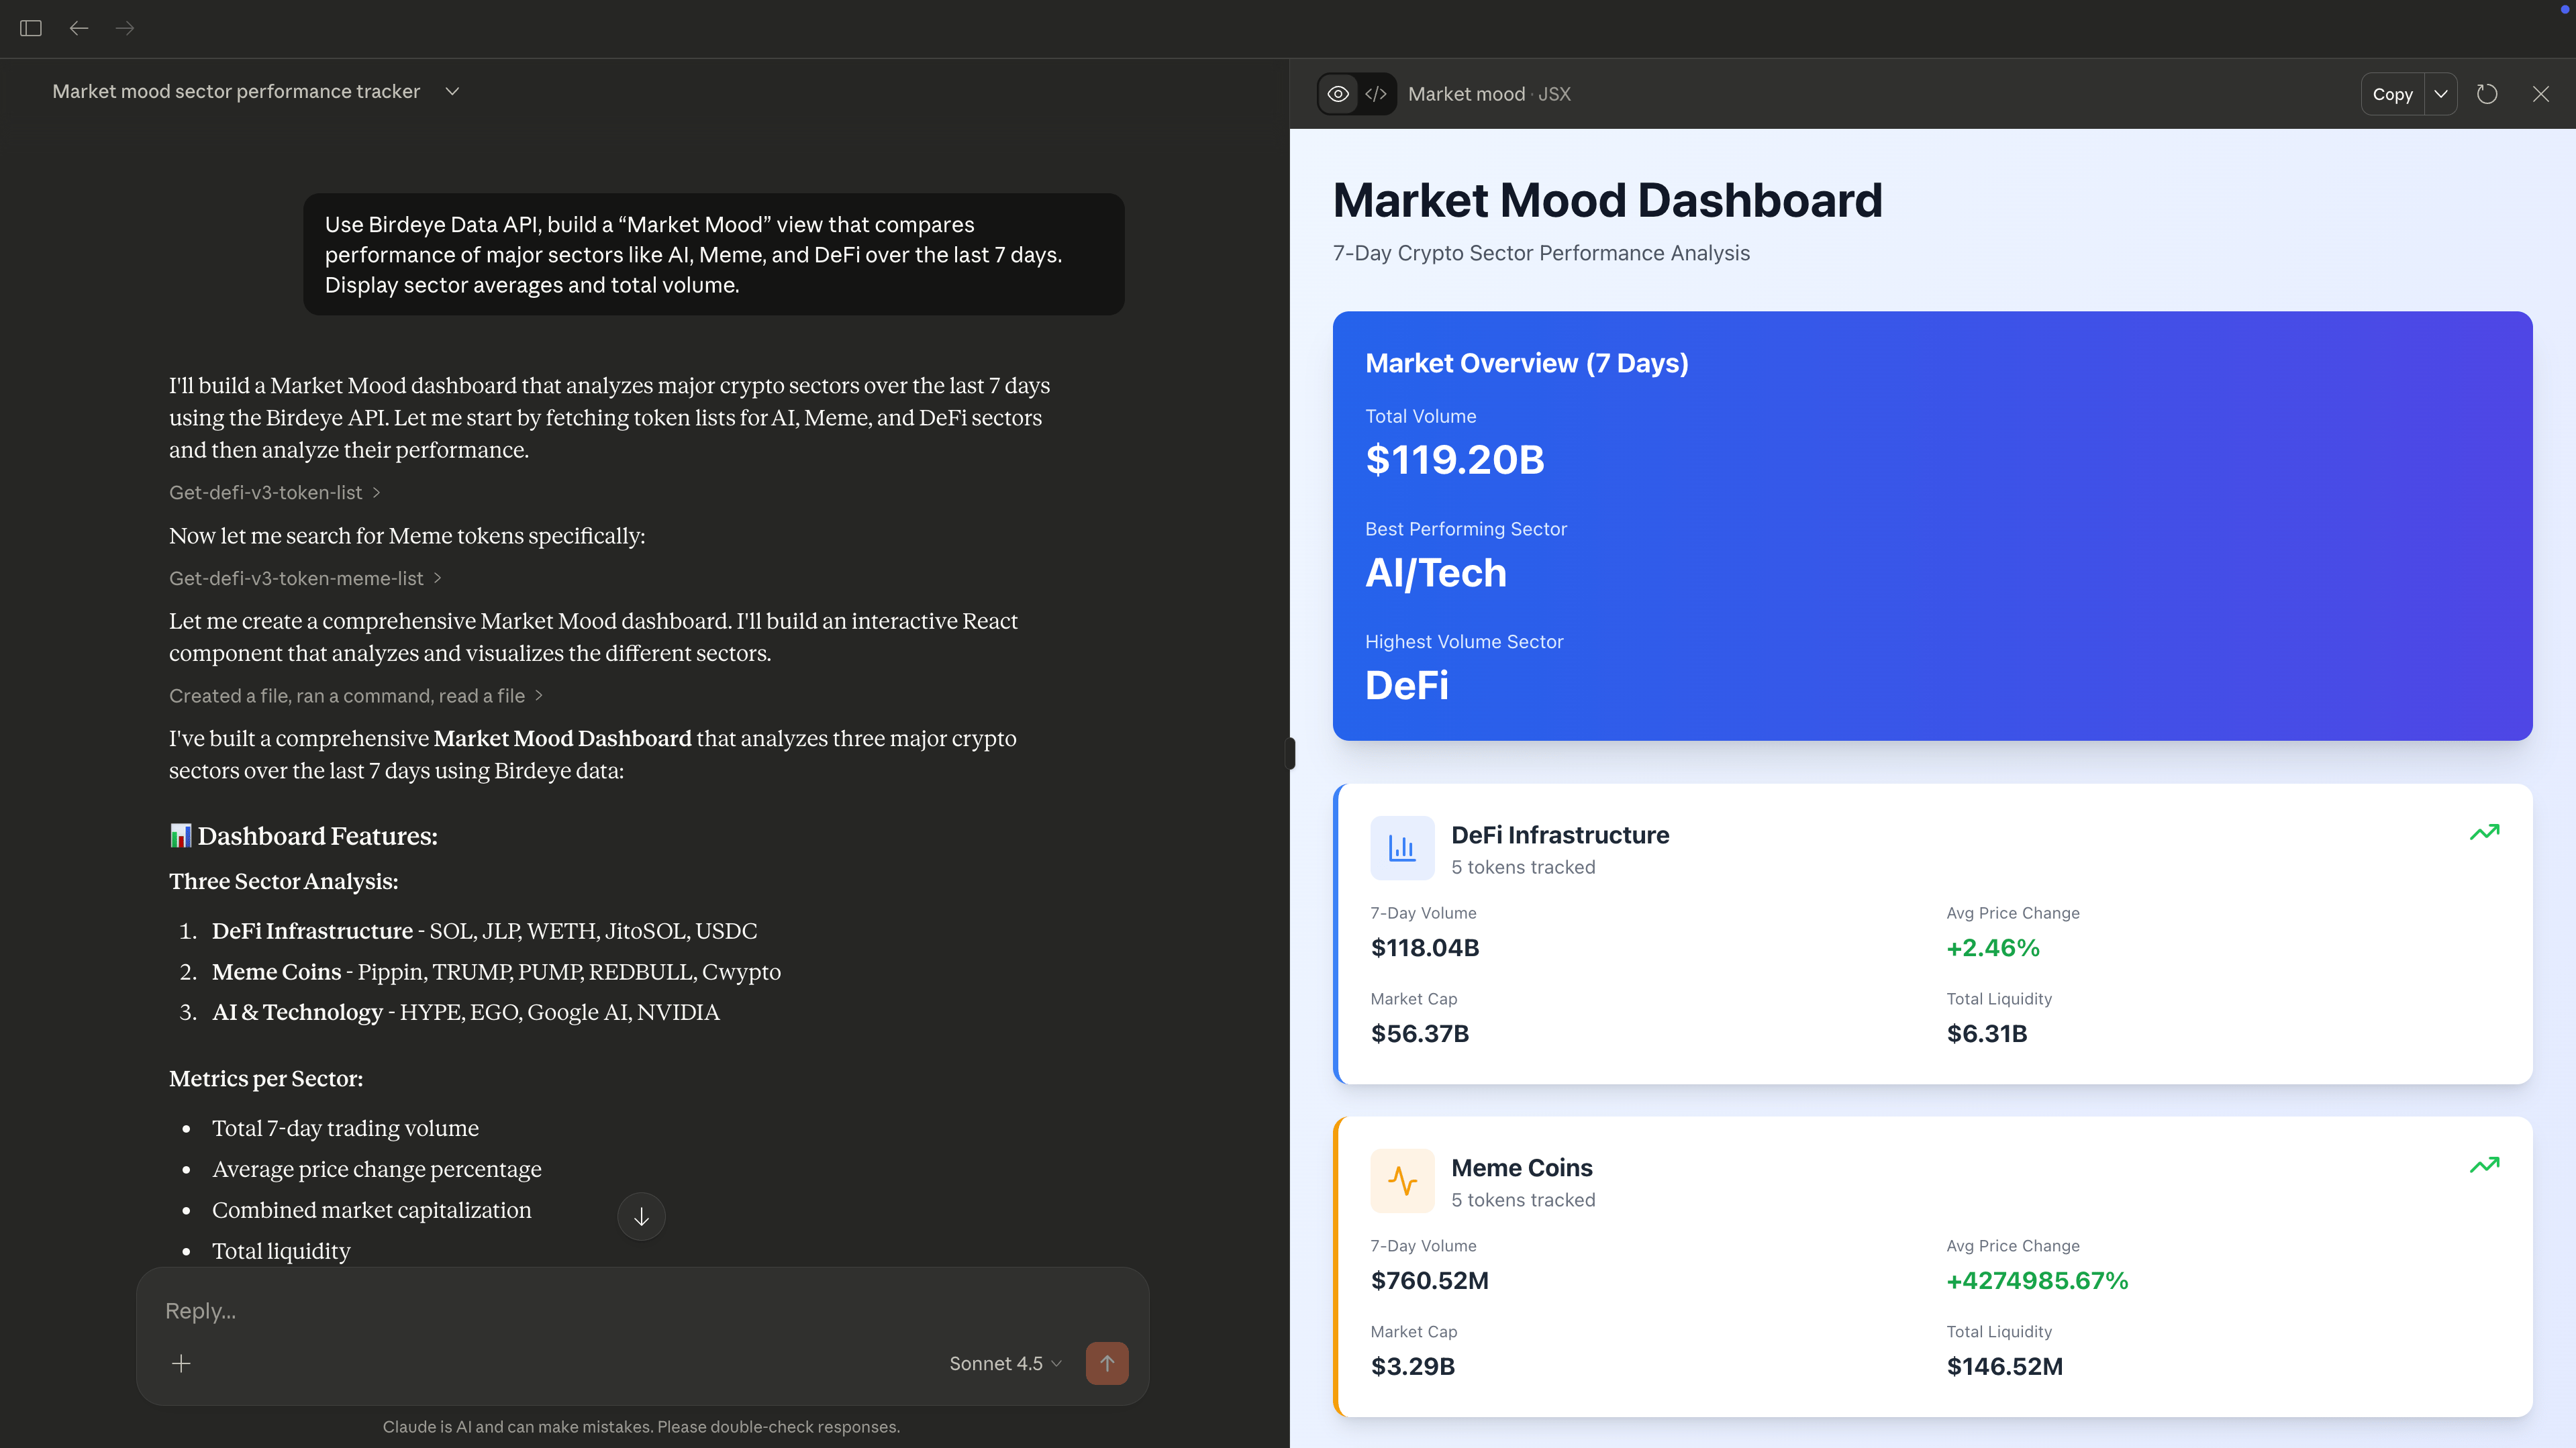
- Explore crypto categories: Effortlessly list coins within specific sectors like Meme, DeFi, Layer 1, AI agent, and more.
Where to start
Birdeye MCP
Connect Claude, Cursor, or any MCP compatible client directly to Birdeye Data. Includes setup for 12+ tools.
Tool Catalog
Look up which endpoint to call for a given task before you write a query.
x402 and Agentic Payments
Skip the API key. Let your agent pay per request with its own wallet.
Example prompts
Use these prompts to get a feel for what an agent connected to Birdeye MCP can do.Simple queries
- What is the current price of Bitcoin in USD?
- What is the current price of JUP in USD?
- What are the top 10 BONK holders?
- What are the top 3 trending coins on Birdeye right now?
- What are the top AI coins on Birdeye now?
Advanced queries
List tokens launched in the last 72 hours with liquidity above $500k. Include price, market cap, liquidity, and 24h volume. Display in an interactive table.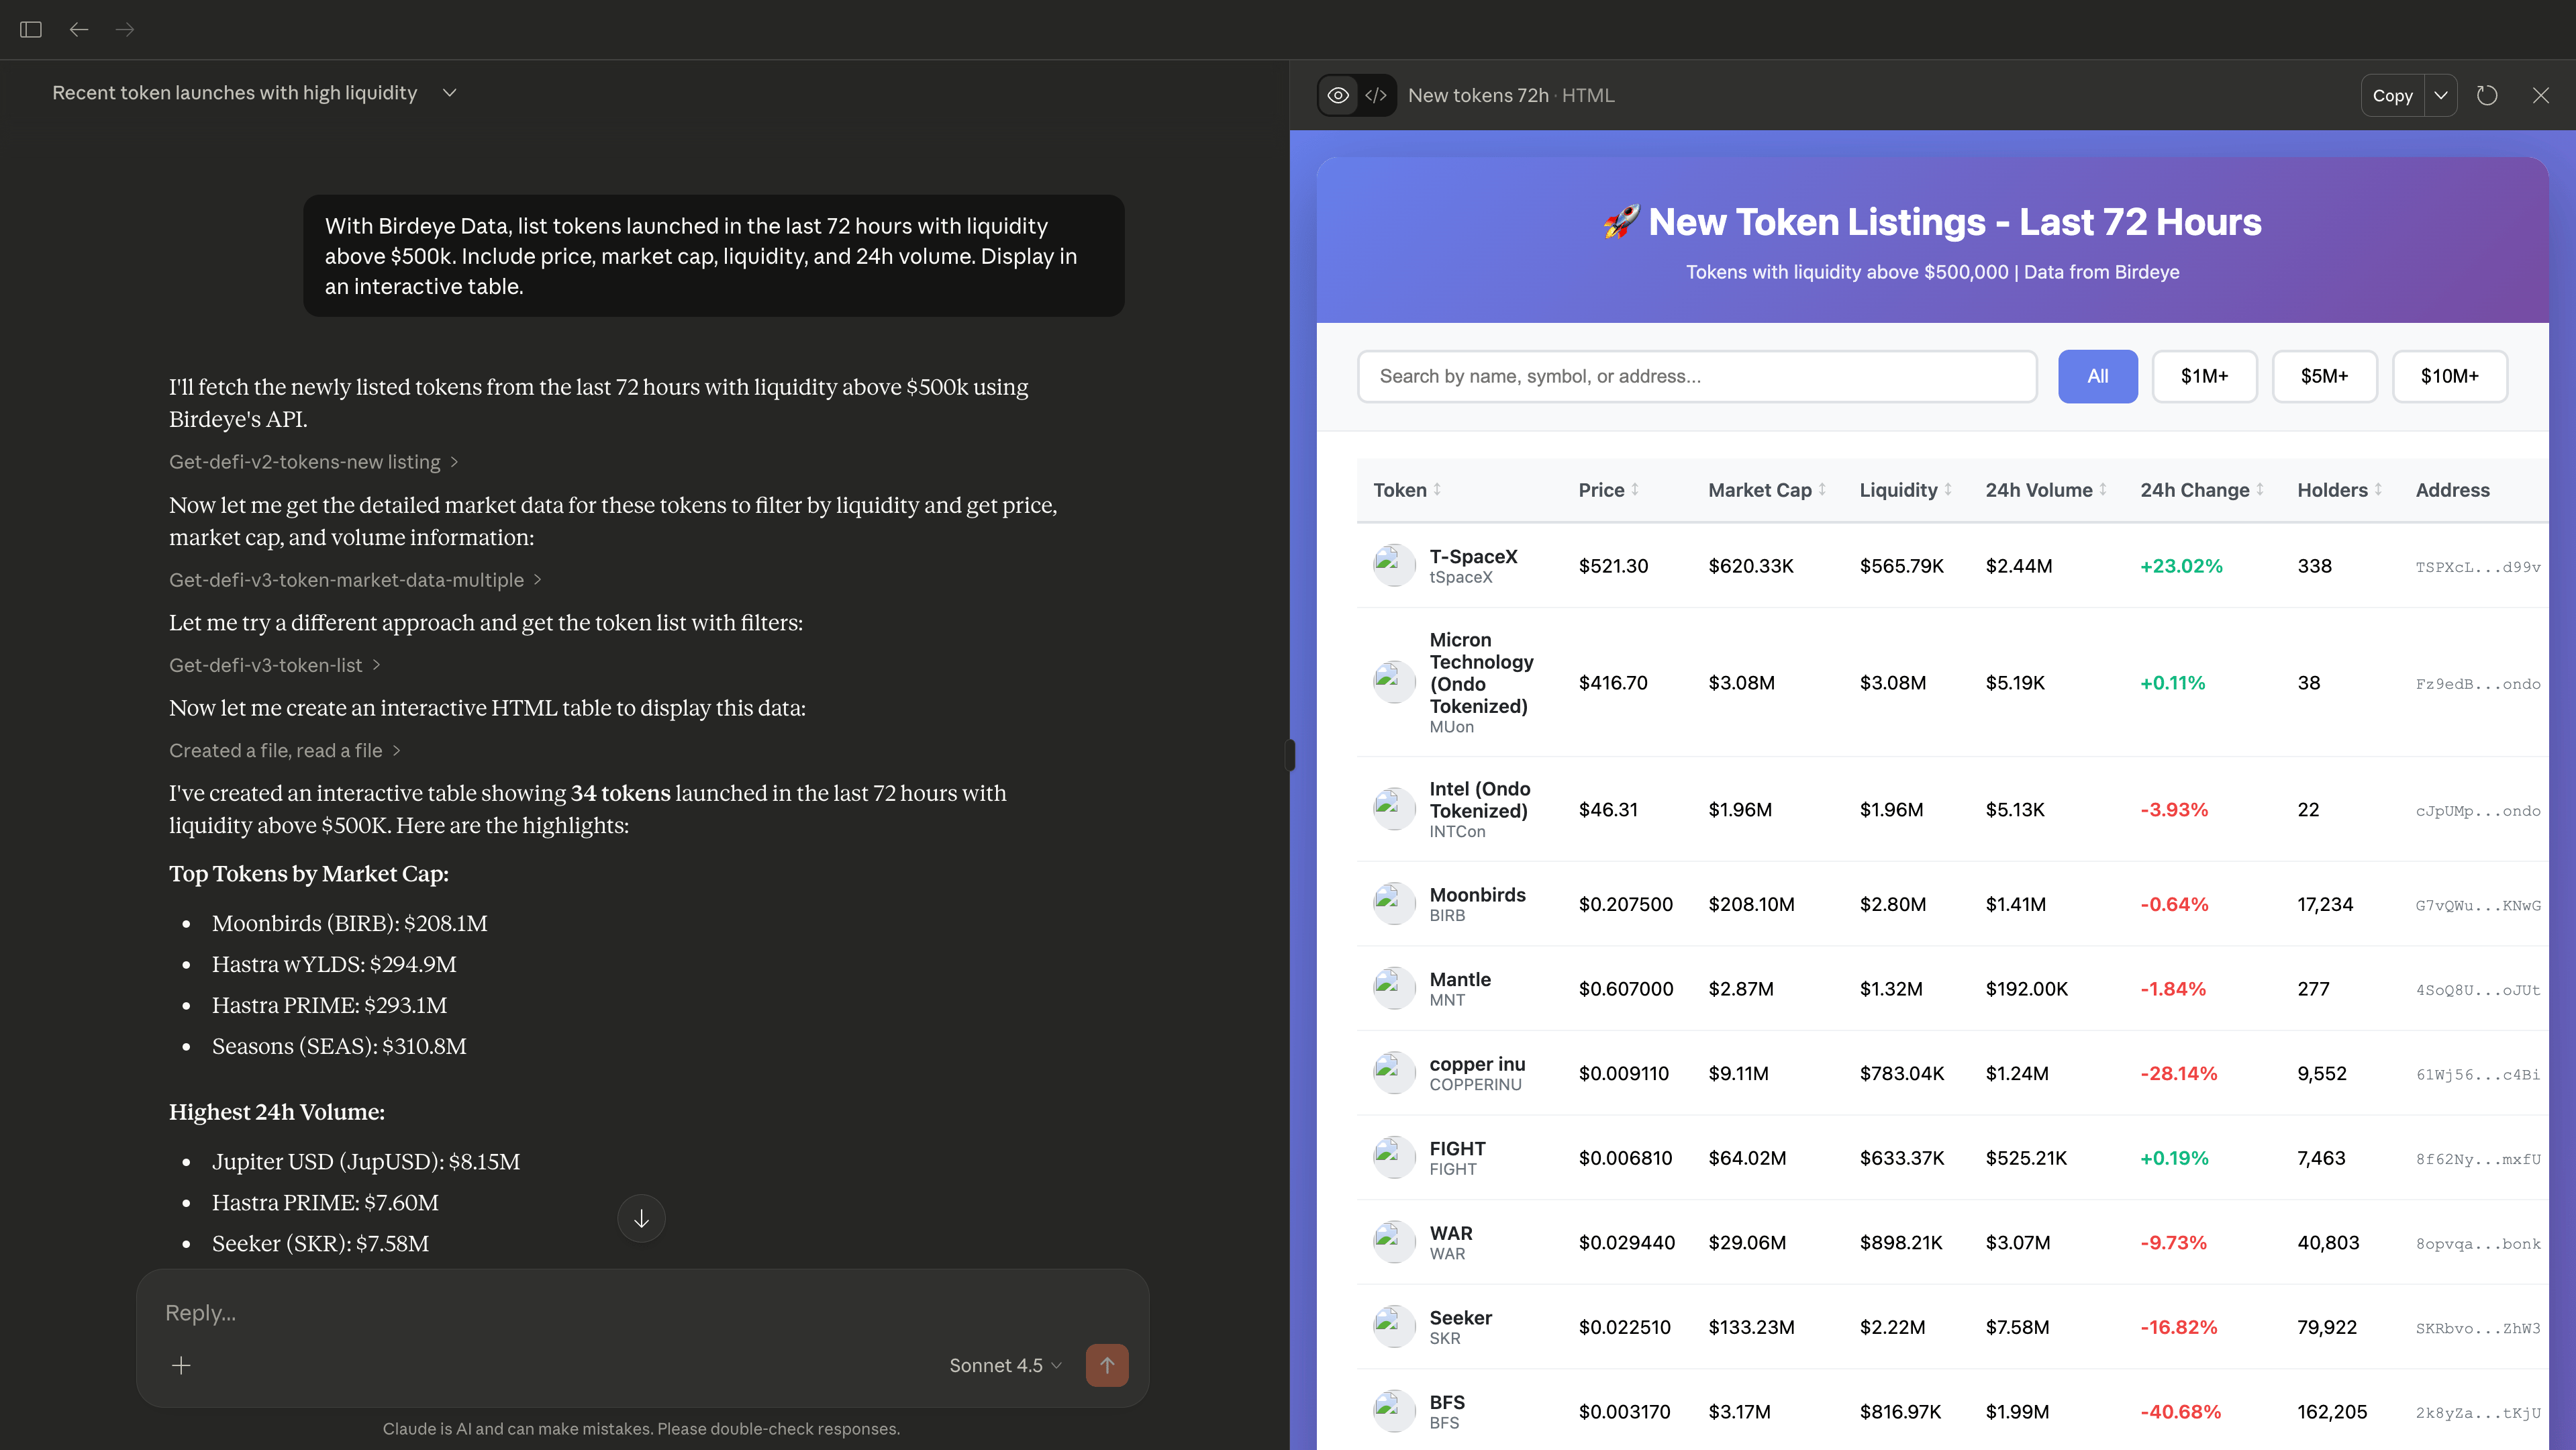
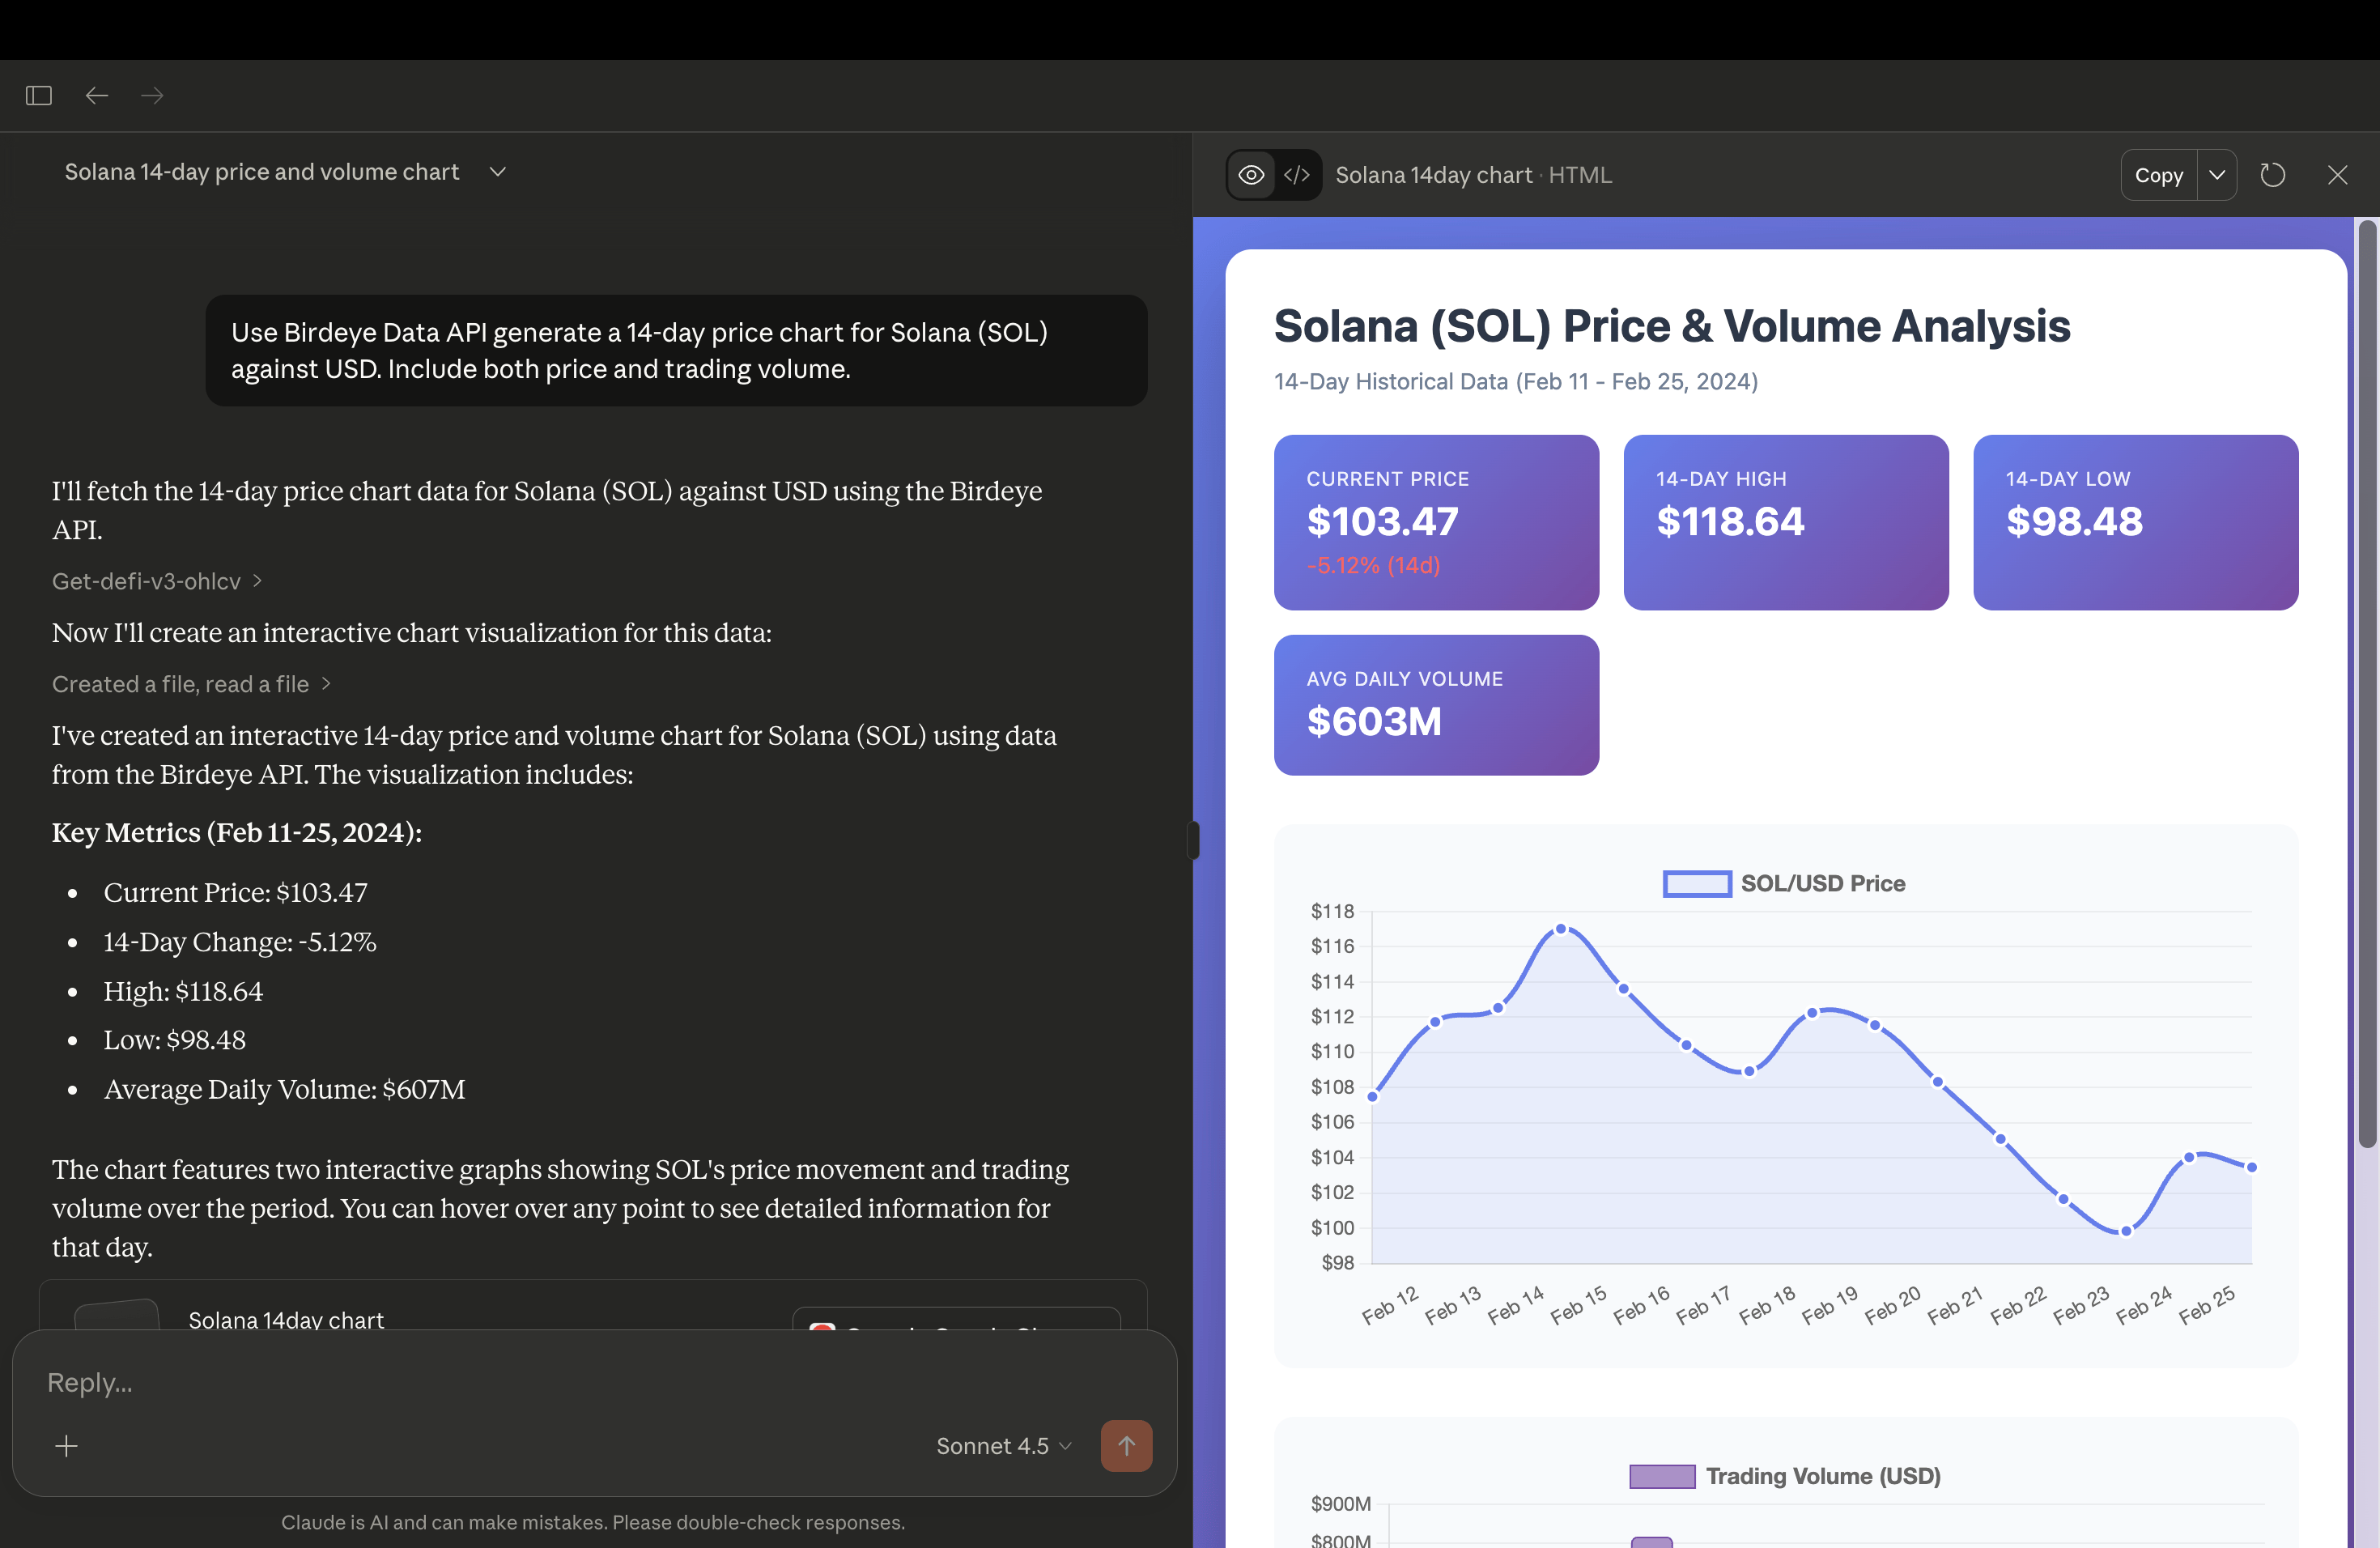
Creative and fun ideas
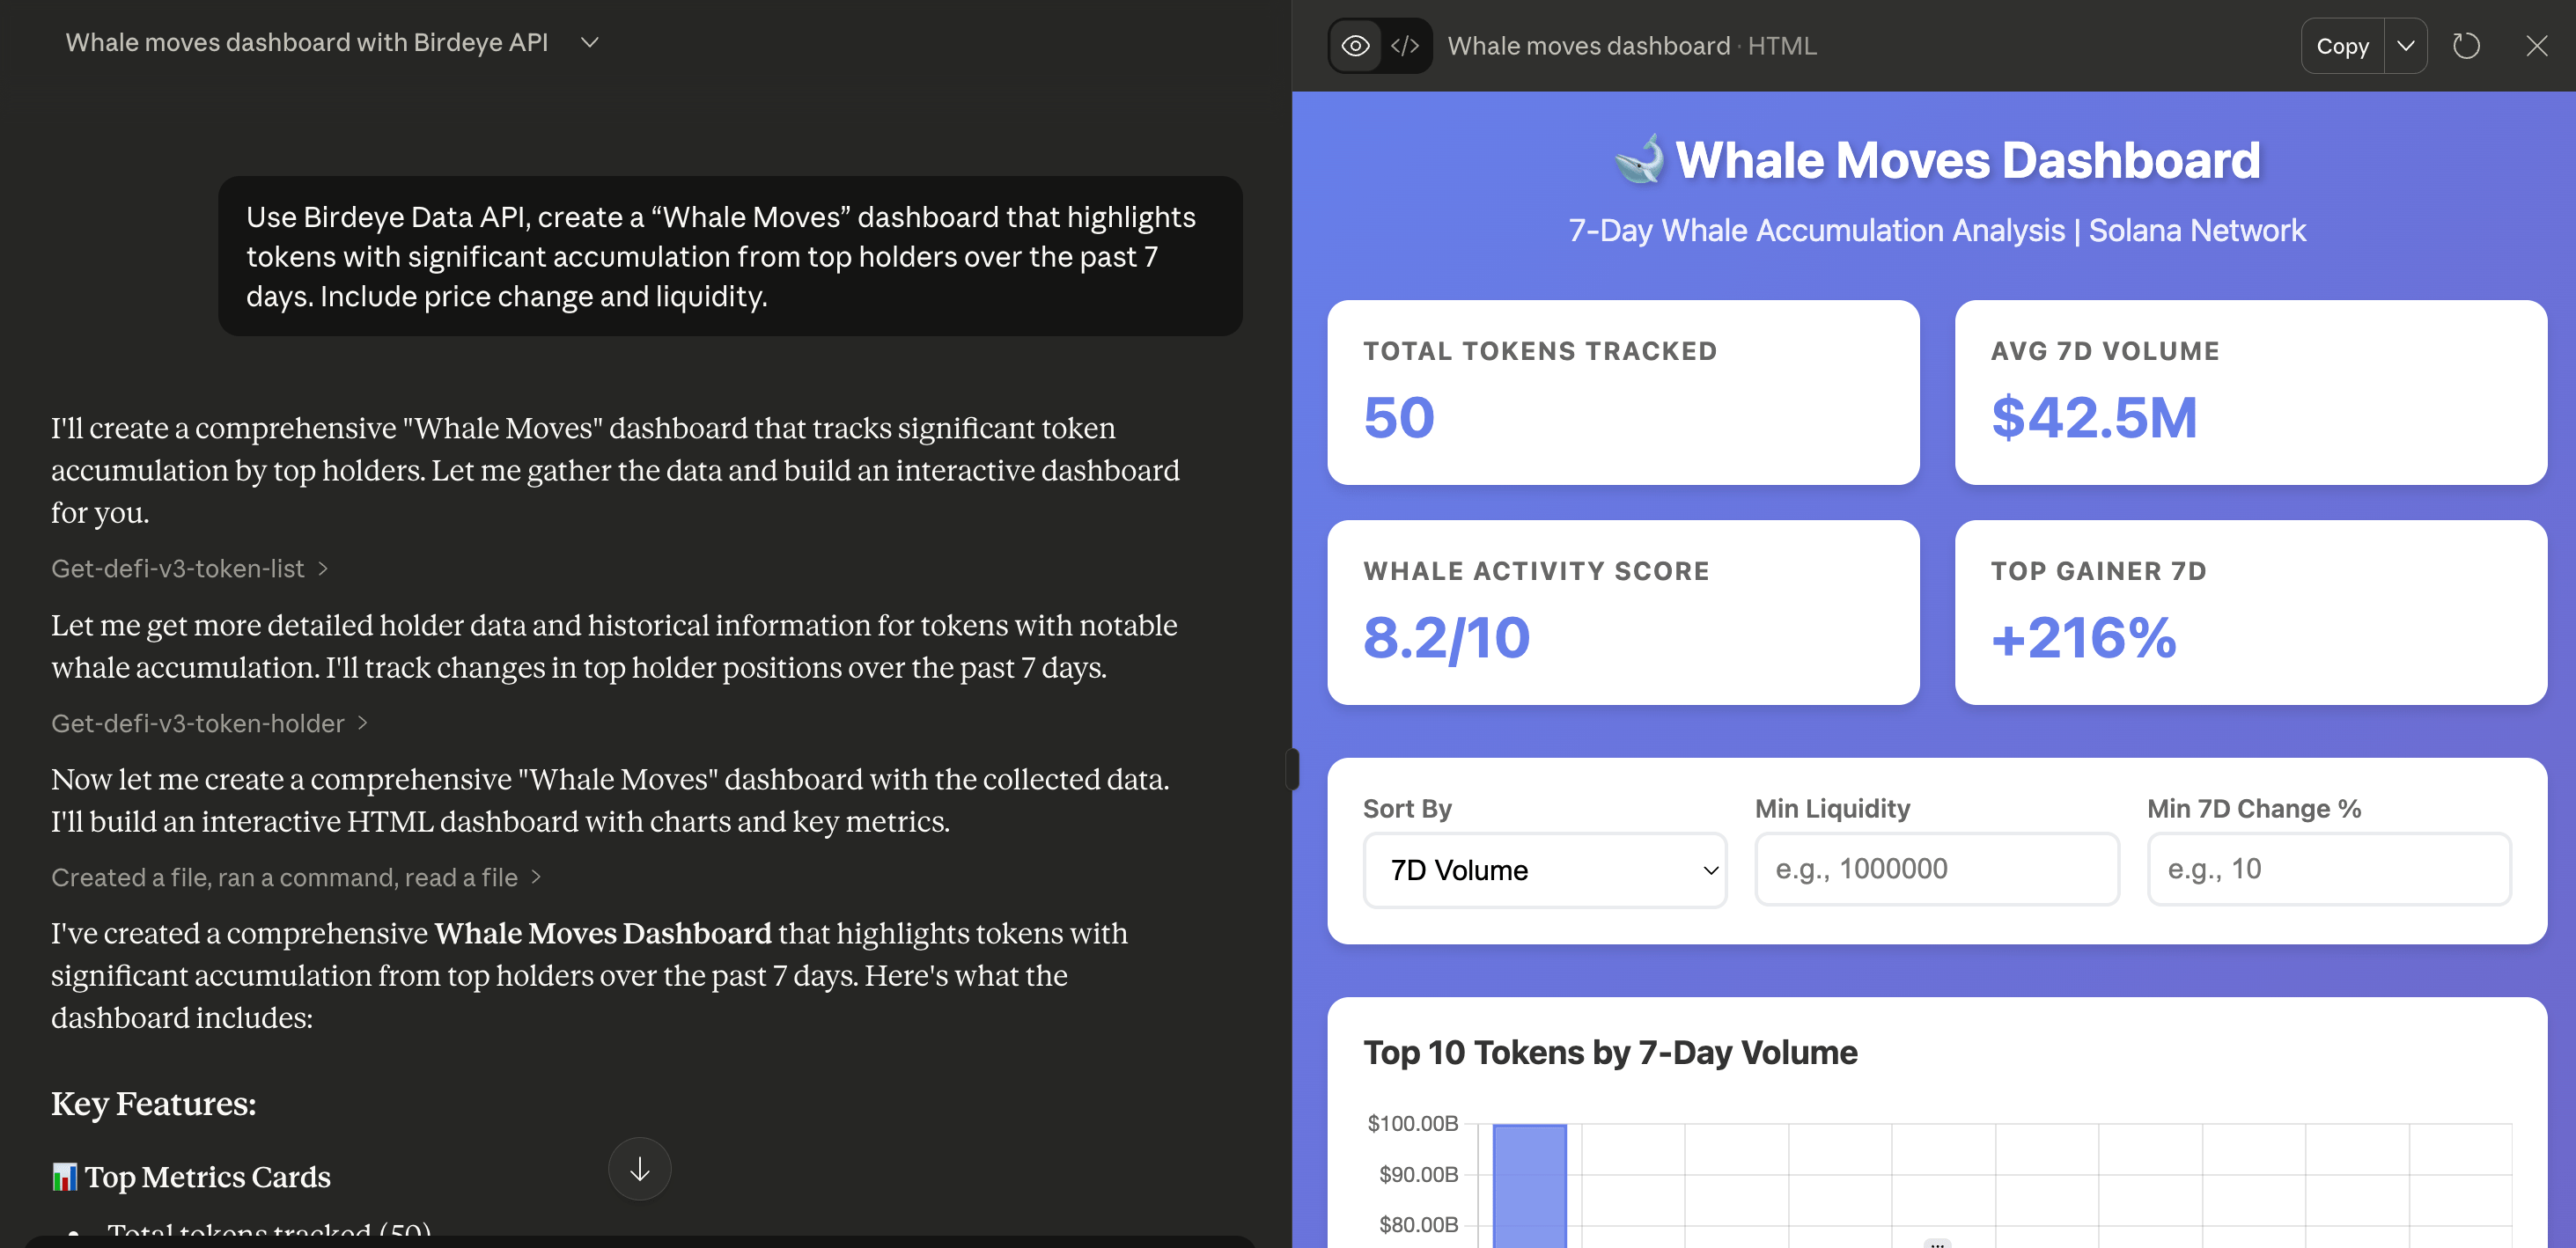
Create a Whale Moves dashboard that highlights tokens with significant accumulation from top holders over the past 7 days. Include price change and liquidity.